
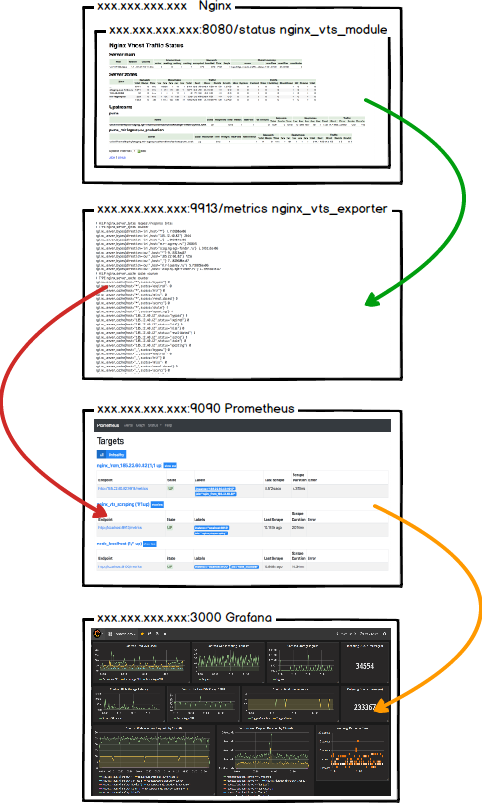
繼續 Raspberry pi 安裝 Prometheus 文章
再往下新增Grafana Dashboard功能
|
1 2 3 4 5 6 7 8 9 10 11 12 13 14 15 16 17 18 19 20 21 22 23 24 25 26 27 28 29 30 31 32 33 34 35 36 37 |
# 下載 grafana $ wget wget https://dl.grafana.com/oss/release/grafana-6.5.1.linux-armv7.tar.gz # 解壓縮 $ tar -zxvf grafana-6.5.1.linux-armv7.tar.gz # 新增系統服務 $ sudo nano /etc/systemd/system/grafana.service # 新增以下內容 [Unit] Description=Grafana UI After=network.target [Service] Type=simple User=pi ExecStart=/home/pi/grafana-6.5.1/bin/grafana-server WorkingDirectory=/home/pi/grafana-6.5.1/ Restart=always RestartSec=10 [Install] WantedBy=multi-user.target #完成後,儲存離開 # 系統重新讀取服務 $ sudo systemctl daemon-reload # 設定開機自動執行 $ sudo systemctl enable grafana # 啟動prometheus $ sudo systemctl start grafana # 查詢執行狀況 $ sudo systemctl status grafana |
完成後即可以到http://localhost:3000,觀看grafana運行狀況
Default 帳號密碼為 admin/admin
先新增DB

在使用左側+圖示Create Import
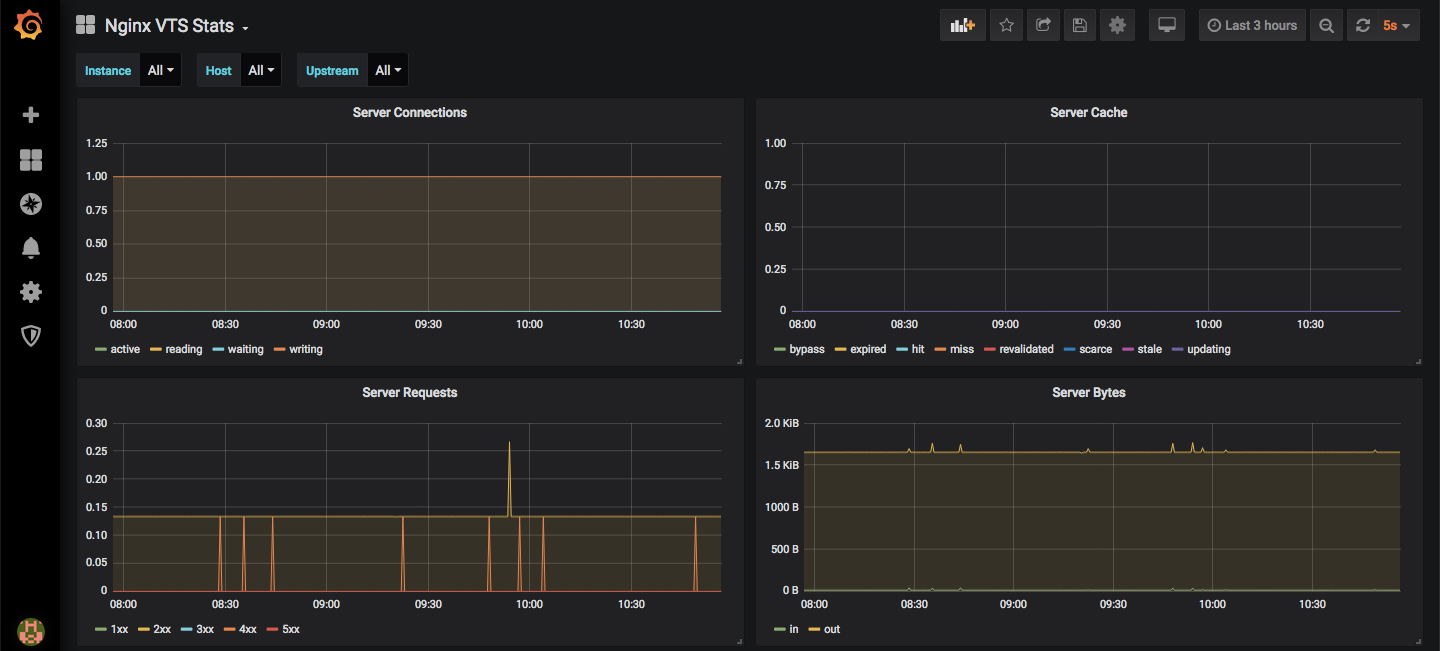
輸入代碼2494,離開輸入框會自動帶入Dashboard資訊

順利完成後如下
Reference